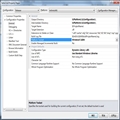
今天小试了一把valgrind的massif工具。Massif在valgrind中的介绍是这样的:
Massif is a heap profiler. It performs detailed heap profiling by taking regular snapshots of a program's heap. It produces a graph showing heap usage over time, including information about which parts of the program are responsible for the most memory allocations. The graph is supplemented by a text or HTML file that includes more information for determining where the most memory is being allocated. Massif runs programs about 20x slower than normal. ? 可以看出Massif是一个内存剖析工具。通过不断的取程序堆的快照来达到监视程序内存分配的目的。Massif
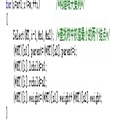
我们来编写一个这样的C++文件:test.cc
?
#include <stdlib.h>
#include <stdio.h>

int *fa()
{
  int *p=(int*)malloc(10000);
  return p;
}

int *fb(int *p)
{
  delete p;
}

int main(void)
{
  printf("ok\n");

  printf("really ok?\n");

  int *vec[10000];

  for(int i=0;i<10000;i++)
  {
    vec[i]=fa();
  }


  for(int i=0;i<10000;i++)
  {
    fb(vec[i]);
  }

  return 0;
}
使用g++进行编译:
g++ test.cc -o test
然后使用valgrind的massif:
valgrind --tool=massif ./test
最后就得到一个massif文件:massif.out.32682 (32682代码进程pid)
使用ms_print来解析这个输出文件:
ms_print massif.out.32682
?最后得到解析结果:
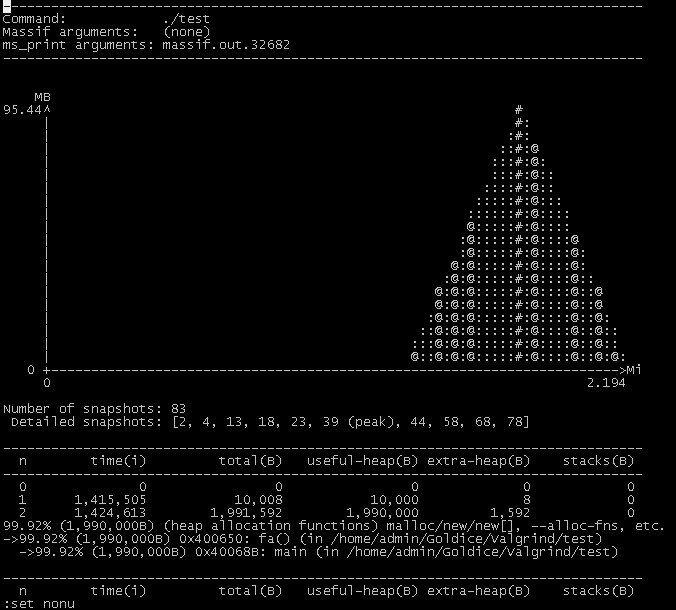
通过图形可以看出Heap随时间变化的变化,可以通过分析下面的函数信息得到究竟是那些函数占用了大量的内存。
?
?
?
?
?
?
?
?