首先,我要说,Highcharts这个东西非常好。
官方地址http://www.highcharts.com
后台数据支持json和xml
贴一个简单的例子,并附上后台数据,这里返回的是JSON,框架使用的是springMVC
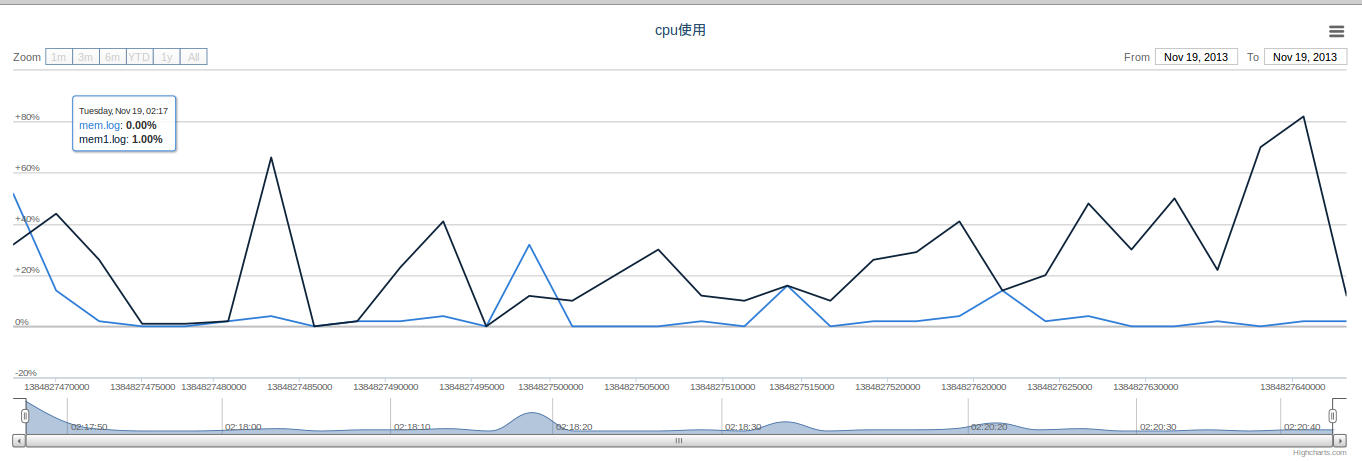
场景描述:监控某个进程的cpu资源使用,并在前台显示
后台关键代码:
?
class="java">/**
	 * test
	 * @param model
	 * @param request
	 * @return
	 */
	@RequestMapping("/monitor/index.do")
	public String index(ModelMap model, HttpServletRequest request) {
		return "view/monitor";
	}
	/**
	 * 测试highchart
	 * @param filename
	 * @return
	 */
	@RequestMapping("/monitor/test.do")
	public @ResponseBody String test(String filename){
		String mem = null;
		try {
			mem = getmem(filename);
		} catch (Exception e) {
			e.printStackTrace();
		}
		return mem;
	}
?
private static String getmem(String filename) throws Exception{
		SimpleDateFormat sdf = new SimpleDateFormat("yyyy-MM-dd hh:mm:ss");
		StringBuffer result = new StringBuffer();
		BufferedReader br = new BufferedReader(new InputStreamReader(MonitorAct.class.getResourceAsStream("/"+filename)));
		String line = null;
		String[] ary = null;
		result.append("[");
		line=br.readLine();
		while(line!=null){
			result.append("[");
			ary = line.split(">");
			result.append(sdf.parse(ary[0]).getTime()).append(",").append(ary[1]);
			result.append("]");
			line=br.readLine();
			if(line != null){
				result.append(",");
			}
		}
		result.append("]");
		return result.toString();
	}
?filename中的数据格式为,格式随意,是key-value就OK
2013-11-19 10:17:47>51.9
2013-11-19 10:17:50>14.0
2013-11-19 10:17:53>2.0
...
?前台代码,JSP
<html xmlns="http://www.w3.org/1999/xhtml">
<head>
<meta http-equiv="Content-Type" content="text/html; charset=UTF-8" />
<title>Insert title here</title>
<script src="${base}/resources/js/jquery.js"></script>
<script src="${base}/resources/js/highstock.js"></script>
<script src="${base}/resources/js/exporting.js"></script>
<script type="text/javascript">
	$(function() {
	var seriesOptions = [],
		yAxisOptions = [],
		seriesCounter = 0,
		names = ['cpu2.log','cpu2.log'];
		colors = Highcharts.getOptions().colors;
	$.each(names, function(i, name) {
		$.getJSON('${base}/monitor/test.do?filename='+name,	function(data) {
			seriesOptions[i] = {
				name: name,
				data: data
			};
			seriesCounter++;
			if (seriesCounter == names.length) {
				createChart();
			}
		});
	});
	function createChart() {
		alert(seriesOptions);
		$('#container').highcharts('StockChart', {
		    chart: {
		    },
		    rangeSelector: {
		        selected: 4
		    },
			title: {
				text: "cpu使用"
			},
			xAxis: {
				labels: {
					formatter: function() {
						return this.value;
					}
				}
			},
		    yAxis: {
		    	labels: {
		    		formatter: function() {
		    			return (this.value > 0 ? '+' : '') + this.value + '%';
		    		}
		    	},

		    	plotLines: [{
		    		value: 0,
		    		width: 2,
		    		color: 'silver'
		    	}]
		    },

		    plotOptions: {
		    	series: {
		    		//compare: 'percent'
		    	}
		    },

		    tooltip: {
		    	pointFormat: '<span style="color:{series.color}">{series.name}</span>: <b>{point.y}%</b><br/>',
		    	valueDecimals: 2
		    },

		    series: seriesOptions
		});
	}

});
</script>
</head>
<body>
<div id="container" style="height: 500px; min-width: 300px"></div>

</body>
</html>
?这里,不得不提醒大家,关于highchart div容器的问题,在我使用时发现这样的问题,浏览器-firefox25.0.1。
Highcharts error #13 http://www.highcharts.com/errors/13
?根据地址,官方说明的比较清楚
Highcharts Error #13
Rendering div not found
This error occurs if the chart.renderTo option is misconfugured so that Highcharts is unable to find the HTML element to render the chart in.
?问题就出在div的id上面...在我的id中带有"."号,居然不行...没法,本来是直接用的ip,改用hostname了。
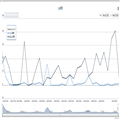
最后附上一张效果图
?
?
?