Rails Study(14)Debugging Rails Applications
1. View Helpers for Debugging
To inspect the contents of a variable. We have 3
ways:
debug
to_yaml
inspect
1.1 debug
if we have this kind of code in a view:
<%= debug @post %>
<p>
<b>Title:</b>
<%=h @post.title %>
</p>
I will see something like this:
--- !ruby/object:Post
attributes:
updated_at: 2008-09-05
body:..
title: Rails debuging guide
1.2 to_yaml
<%= simple_format @post.to_yaml %>
<p>
<b>Title:</b>
<%=h @post.title %>
</p>
The to_yaml method converts the method to YAML format leaving it more readable, and then the simple_format helper is used to render each line as in the console.
--- !ruby/object:Post
attributes:
updated_at: 2008
1.3 inspect
It will print the object value as a string when working with arrays or
hashes.
<%= [1,2,3,4,5].inspect %>
<p>
<b>Title:</b>
<%=h @post.title %>
</p>
1.4 Debugging R
JS
The flag to enable RJS debugging in your configuration
files is config.action_view.debug_rjs:
config.action_view.debug_rjs = true
or set this at any time
ActionView::Base.debug_rjs = true
2. The Logger
Rails maintains a separate log file for each runtime environment.
2.1 What is the Logger?
In evnrionment.rb
Rails.logger = Logger.new(STDOUT)
Rails.logger = Log4r::Logger.new("Application Log")
By default, each log is
created under Rails.root/log/ and the log file name is environment_name.log.
2.2 Log Levels
If you want to know the current log level you
can call the Rails.logger.level method.
The available log levels are: :debug, :info, :warn, :error, and :fatal. To change the default log level, use
config.log_level = Logger::WARN #In any environment initializer, or
Rails.logger.level = 0 #at any time
2.3 Sending Messages
To write message in logger.
logger.debug "Person attributes hash: #{@person.attributes.inspect}"
logger.info "Processing the request..."
logger.fatal "terminating application!!!"
3 Debugging with ruby-debug
3.1 Setup
>gem install ruby-debug
error messages:
ERROR: Error installing ruby-debug:
rbx-require-relative requires Ruby version ~> 1.8.7.
solutions:
>gem install ruby-debug19
add this to
Gemfile
ruby-debug19
Inside any Rails application you can invoke the debugger by calling the debugger method. For example:
class PeopleController < ApplicationController
def new
debugger
@person = Person.new
end
end
if you see the message like this:
***** Debugger
requested, but was not available: Start server with --debugger to enable *****
That is not right, you need to start your application like this:
>rails server --debugger
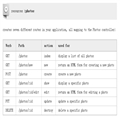
3.2 The Shell
(rdb:7) help ---- show the help information
(rdb:7) list ------- list where we are about the codes
(rdb:7) l ----------- list the below lines in the codes
3.3 The Context
3.4 Threads
3.5 Inspecting Variables
Any
expression can be evaluated in the current context. To evaluate an expression, just type it!
@posts = Post.find(:all)
(rdb:11) instance_variables
>(rdb:11) instance_variables.include? "@posts"
>(rdb:1) display @recent_comments
3.6 Step by Step
The difference between next and step is that step stops at the next line of code executed, doing just a single step, while next moves to the next line without descending inside methods. For example:
class Author < ActiveRecord::Base
has_one :editorial
has_
many :comments
def find_recent_comments(limit = 10)
debugger
@recent_comments ||= comments.find(
:all,
:conditions => [ "created_at > ?", 1.week.ago],
:limit => limit
)
end
end
>rails console
>> require "ruby-debug"
>> (rdb:1) list
>> (rdb:1) var instance
>> (rdb:1) next
3.7 Breakpoints
3.8 Catching Exceptions
3.9 Resuming Excecution
3.10 Editing
3.11 Quitting
3.12 Settings
4 Debugging Memory Leaks
4.1 BleakHouse
BleakHouse is a library for finding memory leaks.
>gem install bleak_house
error messages:
ERROR: Error installing bleak_house:
ERROR: Failed to build gem native extension.
d:/tool/Ruby192/bin/ruby.exe extconf.rb
-%{ BUILDING RUBY }%-
build_ruby.rb:33:in `chdir': No such file or directory - /tmp/ (Errno::ENOENT)
from build_ruby.rb:33:in `<main>'
solutions:
do not try to install this on win7, try on redhat or ubuntu.
To setup my applicatiion for profiling, add the following at the bottom of config/environment.rb
require 'bleak_house' if ENV['BLEAK_HOUSE']
start server like this:
>RAILS_ENV=production BLEAK_HOUSE=1 ruby-bleak-house rails server
Make sure to run a couple hundred requests to get better data samples. Press CTRL-C and the bleak house will produce a dumpfile in /tmp:
4.2 Valgrind
Valgrind is a Linux-only application for detecting C-based memory leaks and race conditions.
5
Plugins for Debugging
references:
http://guides.rubyonrails.org/debugging_rails_applications.html
http://www.tatvartha.com/2011/08/upgrading-to-ruby-1-9-rbx-require-relative-requires-ruby-version-1-8-7/