?
class="juejin-editor-bold" style="font-weight: bolder;">Matplot3D for JAVAЃЈV3.0ЃЉ?ЪЧвЛИіЛљгкJAVA SE 1.8ЛЗОГПЊЗЂЕФШ§ЮЌЪ§бЇЭМаЮЭМБэзщМўЁЃ?зщМўгЩДПJAVA SE ЪЕЯжЃЈPure JavaЃЉ?ЃЌЗтзАЮЊвЛИіjarАќЃЌjarЮФМўДѓаЁВЛГЌЙ§300KBЁЃФкКЌзджїбаЗЂЕФШ§ЮЌМИКЮдьаЭЁЂЛцжЦЫуЗЈЃЌЮоашвРРЕOpenGLЁЂDriectXЁЂJAVA 3DЛђJAVAFXЕШЕШЕкШ§ЗНПтЃЌЦфжЛвРЭаJREздДјЕФРрПтМДПЩЃЈМДжЛашАВзАСЫJAVAОЭПЩЪЙгУЃЉЃЌПЩвдЗЧГЃЗНБуЕФНЋMatplot3D for JAVA(V3.0)ЯдЪОУцАхЧЖШыЕНздМКJAVA GUIГЬађжаЁЃРрЫЦ Python ЕФmatplotlib
БОзщМўЬсЙЉМђЕЅЕФЭтЙлAPIЃЌПЩвдЗНБуЩњГЩШ§ЮЌаЇЙћЕФЭМаЮЭМБэЁЃПЩгУгкДѓЪ§ОнПЩЪгЛЏЁЂПЦбЇЪ§ОнЗжЮіПЩЪгЛЏЕШСьгђЁЃдкЪЙгУGUIЯдЪОЪБжЇГжЪѓБъЕШЪфШыЩшБИНЛЛЅЪНВйзїЃЌПЩЗНБуЕФЫѕЗХКЭИФБфЙлВьНЧЖШЁЃжЇГжЖЏЬЌБрГЬЃЌПЩЪЕЪБЩњГЩШ§ЮЌФЃаЭЖЏЬЌИФБфЖЏЛЁЃвВПЩвдИљОнЪфШыЕФЪ§ОнжБНгЩњГЩЭМЦЌЮФМўЃЌетПЩгУгкЖЏЬЌWebЕФЗўЮёЖЫЃЌДгвГУцДЋШыЕФЪ§ОнЩњГЩЭМЯёЮФМўЃЌЗЕЛиИјвГУцЯдЪОЁЃ
?
ТыдЦ:? ? ??https://www.gitee.com/tanling8334/Matplot3D-for-Java
Github:??https://github.com/tanling8334/Matplot3D-for-Java
?
ЭъећAPIЧыВЮПДЩЯУцСЌНгжаЕФReadme.mdЮФЕЕЃЌЦфжаЕФdemoНсЮВЕФ.jarЮФМўЪЧПЩжДааЮФМўЃЌЪЕМЪПЊЗЂЪЙгУЪБВЛашвЊв§гУЁЃЧыдкАВзАСЫ64ЮЛjavaЕФЯЕЭГжадЫааЃЌдЫааdemoПЩвдПДЕНЪЕМЪаЇЙћКЭЪОР§ДњТыЁЃЪЕВтдкJAVA8КЭJAVA17ЩЯЪЙгУаЇЙћНЯКУЁЃЛЖгДѓМвЭЦЙуЪЙгУКЭНЛСїЁЃ
зїепСЊЯЕЗНЪНЃК
email : ta8334@126.com? QQ : 17746302
?
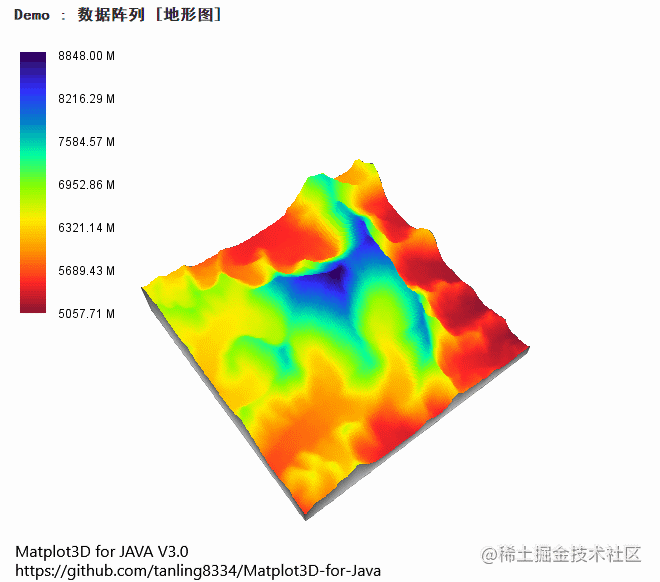
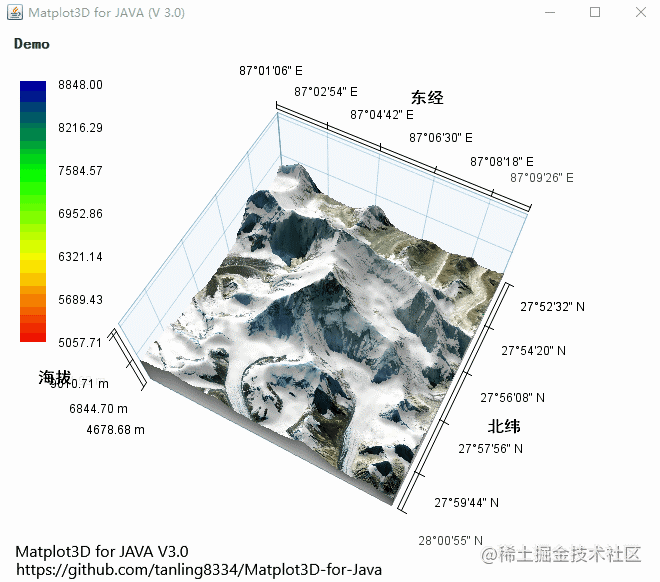
?ЕиаЮЪ§ОнПЩЪгЃЈЖЏЭМЃЉ?
?в§ЧцЙІФмеЙЪО ЕиЧђЃЈЖЏЭМЃЉ
?в§ЧцЙІФмеЙЪО жщЗхЃЈЖЏЭМЃЉ
?
?Ъ§ОнеѓСаЃК
Ъ§ОнеѓСа ЪОР§ДњТыЃК
?
?
?
import java.util.Random;
import tanling.matplot3d.app.facade.DataGridProcessor;
import tanling.matplot3d.app.facade.Matplot3D4JMgr;
import tanling.matplot3d.common.Range;
import tanling.matplot3d.d3d.color_style.ColorStyle;
import tanling.matplot3d.d3d.color_style.TopBottomColorStyle;
public class DataGridDemo {
public static void main(String[] args) {
DataGridProcessor processor = new DataGridProcessor();
final Matplot3D4JMgr mgr=new Matplot3D4JMgr(processor);
//=======================================
//зМБИФуЕФЪ§ОнЃЌЪЧвЛИіЖўЮЌDoubleЪ§зщЁЃБэЪООљдШЗжВМЕФЭјИёЕуЃЌЪ§зщФкЕФжЕБэЪОИпЖШ
//Ъ§ОнвЛАуРДдДгкОпЬхгІгУЕФЗЧЙцдђКЏЪ§Ъ§ОнЃЌР§ШчФГЧјгђЕФDEMЕиаЮИпГЬЪ§Он
//вдЯТДњТыДДдьвЛаЉащФтЪ§ОнгУгкеЙЪОШчКЮЪЙгУ
Double[][] datas=new Double[20][20];
Random random=new Random();
for(int i=0;i<datas.length;i++) {
for(int j=0;j<datas[0].length;j++) {
if(i+j<20)
datas[i][j]=(double)i+j+random.nextDouble();
else
datas[i][j]=40d-i-j-random.nextDouble();
}
}
//=======================================
//ДДНЈвЛИібеЩЋЗчИё
ColorStyle cs = new TopBottomColorStyle(ColorStyle.DEFAULT_COLORS_ARRAY);
mgr.setCoordianteSysShowType(Matplot3D4JMgr.COORDINATE_SYS_ALWAYS_FURTHER);
processor.setClose3DObject(true);//ЩшжУЪЧЗёЪЧЗтБеШ§ЮЌЖдЯѓ
mgr.setScaleX(1);
mgr.setScaleY(1);
mgr.setScaleZ(1.2);
mgr.setTitle("Demo Ъ§ОнеѓСа");
processor.setShowGrid(false);//ЪЧЗёЯжЯдЪОИЈжњЭјИёЯп
processor.addData(datas, "", new Range(0, 100), new Range(100, 200), 20, 20, cs, 1f);
mgr.show();
}
}
?
?
ЕудЦ ЃК
?
?в§ЧцЙІФмеЙЪО жщЗхЃК?
?КЏЪ§ЧњУцЃК
?КЏЪ§ЧњУцЪОР§ДњТы
?
?
?
import tanling.matplot3d.app.facade.Function;
import tanling.matplot3d.app.facade.FunctionProcessor;
import tanling.matplot3d.app.facade.Matplot3D4JMgr;
import tanling.matplot3d.common.Range;
public class FunctionSurfaceDemo {
public static void main(String[] args) {
FunctionProcessor processor = new FunctionProcessor();
final Matplot3D4JMgr mgr=new Matplot3D4JMgr(processor);
//ЖЈвхЖўЮЌКЏЪ§ЃЌИљОнxyжЕЧѓyжЕ
Function f = new Function() {
public Double f(double x, double y) {
return Math.sin(y * x / 2.2) * 0.8;
}
};
double pi = Math.PI;
//НЋЖўЮЌКЏЪ§МгШыДІРэЦїЃЌЩшжУXYЗНЯђЯдЪОЗЖЮЇКЭВЩбљЗжЖЮЪ§
//ПЩвдМгШыЖрИіКЏЪ§
processor.addData(f, "", new Range(-1.5*pi, 1.5*pi), new Range(-1.5*pi, 1.5*pi), 60, 60);
mgr.setScaleZ(1.5);
mgr.setScaleX(1.3);
mgr.setScaleY(1.3);
mgr.setSeeta(1.3);
mgr.setBeita(1.1);
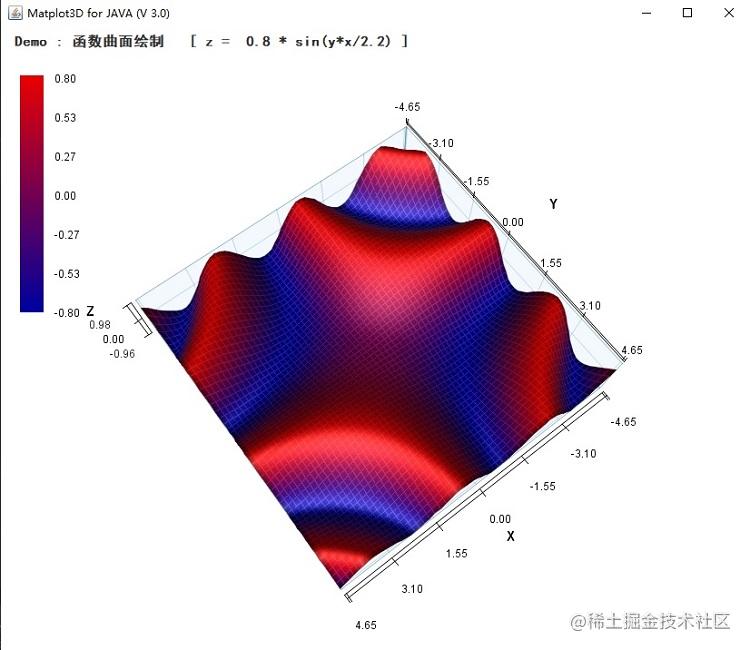
mgr.setTitle("Demo : КЏЪ§ЧњУцЛцжЦ [ z = 0.8 * sin(y*x/2.2) ]");
mgr.setCoordianteSysShowType(mgr.COORDINATE_SYS_ALWAYS_FURTHER);
mgr.show();
}
}
?
?
ЛьКЯЪ§ОнЃК?
?ИЁЕёаЇЙћЃК
?ЩЂЕуЃК
?дЦЭМЃК
дЦЭМЪОР§ДњТыЃК
?
?
?
import java.awt.Color;
import java.util.Random;
import tanling.matplot3d.app.facade.ContourDataGridProcessor;
import tanling.matplot3d.app.facade.Matplot3D4JMgr;
import tanling.matplot3d.common.Range;
public class ContourDataGridDemo {
public static void main(String[] args) {
ContourDataGridProcessor processor = new ContourDataGridProcessor();
// DataGridProcessor processor = new DataGridProcessor();
Matplot3D4JMgr mgr=new Matplot3D4JMgr(processor);
//=======================================
//зМБИФуЕФИпЖШЪ§ОнЃЌЪЧвЛИіЖўЮЌDoubleЪ§зщЁЃБэЪООљдШЗжВМЕФЭјИёЕуЃЌЪ§зщФкЕФжЕБэЪОИпЖШ
//Ъ§ОнвЛАуРДдДгкОпЬхгІгУЕФЗЧЙцдђКЏЪ§Ъ§ОнЃЌР§ШчФГЧјгђЕФDEMЕиаЮИпГЬЪ§Он
//вдЯТДњТыДДдьвЛаЉащФтЪ§ОнгУгкеЙЪОШчКЮЪЙгУ
Double[][] datas=new Double[100][100];
Random random=new Random();
for(int i=0;i<datas.length;i++) {
for(int j=0;j<datas[0].length;j++) {
datas[i][j]=-0.1*Math.pow(100d-i-j,2)+1000;
}
}
//=======================================
//=======================================
//зМБИФуЕФЯдЪОЪ§ОнvaluesЃЌЪЧвЛИіЖўЮЌDoubleЪ§зщЃЌЁЃБэЪООљдШЗжВМЕФЭјИёЕуЃЌЪ§зщФкЕФжЕБэЪОЗЧxyzЕФЕкЫФЮЌБъСПЪ§Он
//valuesЕФааСаЗжВМПЩвдВЛгыdatasвЛжТЃЌЕЋНЈвщзюКУвЛжТвдгХЛЏЯдЪОаЇЙћ
//вдЯТДњТыДДдьвЛаЉащФтЪ§ОнгУгкеЙЪОШчКЮЪЙгУ
Double[][] values=new Double[50][50];
for(int i=0;i<values.length;i++) {
for(int j=0;j<values[0].length;j++) {
double temp=Math.sqrt(Math.pow(i-25d,2)+Math.pow(j-25d,2));
// if(temp<15)
values[i][j]=temp;
}
}
//=======================================
mgr.setCoordianteSysShowType(Matplot3D4JMgr.COORDINATE_SYS_ALWAYS_FURTHER);
processor.setClose3DObject(true);//ЩшжУЪЧЗёЪЧЗтБеШ§ЮЌЖдЯѓ
mgr.setScaleX(5);
mgr.setScaleY(5);
mgr.setScaleZ(0.2);
mgr.setTitle("Demo ЖўЮЌдЦЭМ");
processor.setShowGrid(false);//ЪЧЗёЯжЯдЪОИЈжњЭјИёЯп
Color baseColor=Color.GRAY;//дЦЭМашвЊвЛИіЛљЩЋ
processor.addData(datas, values,baseColor, "my_name", new Range(0, 100), new Range(100, 200), 20, 20, 1f);
mgr.show();
}
}
?
?
елЯпЃК
?елЯпЭМЪОР§ДњТыЃК
?
?
?
import java.awt.Color;
import java.awt.Font;
import java.awt.geom.Point2D;
import java.util.ArrayList;
import java.util.List;
import java.util.Random;
import tanling.matplot3d.app.facade.LineChartProcessor;
import tanling.matplot3d.app.facade.Matplot3D4JMgr;
public class LineChart2dsDemo {
public static void main(String[] args) {
LineChartProcessor processor = new LineChartProcessor();
Matplot3D4JMgr mgr=new Matplot3D4JMgr(processor);
Random ra = new Random();
// int groupCount = 5;
int pointCount = 25;
//==================================================
//дкДЫзМБИЪ§Он
//елЯпЭМжаЫљгаЦНУцжаЖўЮЌЕугЩPoint2D.DoubleБэЪОЃЌАДееЫГађЗХШыList<Point2D.Double>жа
//prepare your data here
List<Point2D.Double>[] targets = new ArrayList[pointCount];
// ЩшжУзюжеЕФЪ§Он
for (int c = 1; c <= targets.length; c++) {
List<Point2D.Double> li = new ArrayList<Point2D.Double>();
targets[c - 1] = li;
for (int i = 0; i < pointCount; i++) {
li.add(new Point2D.Double(i, i * c * 0.05 + (ra.nextDouble() * 0.8)));
}
}
//НЋЪ§ОнМгШыДІРэЦї
processor.addData("ItemЯЕСа 1", null, targets[0]);
processor.addData("ItemЯЕСа 2", null, targets[1]);
processor.addData("ItemЯЕСа 3", null, targets[2]);
processor.addData("ItemЯЕСа 4", null, targets[3]);
processor.addData("ItemЯЕСа 5", null, targets[4]);
mgr.setBeita(4.3);
mgr.setSeeta(0.3);
mgr.setScaleY(1);
mgr.setScaleX(1);
mgr.setScaleZ(1.6);// РЩьZЗНЯђ,ЪЙЭМаЮЯдЕУИќИп
mgr.setTitle("Demo : ЖрВу2ЮЌелЯпЭМ");
mgr.setRulerYVisable(false);
mgr. setXName("X_дТЗн");
mgr. setZName("Z_жИБъ");
mgr. setRulerTextColor(new Color(11, 79, 107));
mgr. setRulerTextFont(new Font("ЗНе§е§ПЌ", Font.PLAIN, 13));
mgr. setAxisNameTextColor(new Color(138, 171, 205));
// здЖЈвхБъГпЃЈЪЙБъГпВЛЪЙгУФЌШЯЕФЪ§СПНјааЯдЪОЃЉ
String[] labels = new String[13];
double[] positions = new double[13];
labels[0] = " 2019 "; // МгШыПеИёЛсРЉДѓЮФзжКЭБъГпЕФОрРы
positions[0] = 0;
for (int i = 2; i < pointCount; i += 2) {
labels[i / 2] = i / 2 + "дТ";
positions[i / 2] = i;
}
mgr. setRulerLabelsX(labels, positions);//ЩшжУXЗНЯђБъГпздЖЈвхПЩЖСЮФзж
mgr. setRulerYVisable(false);//ВЛЯдЪОYЗНЯђБъГп
mgr. setCoordianteSysShowType(Matplot3D4JMgr.COORDINATE_SYS_STABLE);
mgr.show();
}
}
?
?
жљзДЭМЃК
жљзДЭМЪОР§ДњТыЃК
?
?
?
import java.util.Random;
import tanling.matplot3d.app.facade.HistogramProcessor;
import tanling.matplot3d.app.facade.Matplot3D4JMgr;
public class BarsDemo {
public static void main(String[] args) {
HistogramProcessor processor = new HistogramProcessor();
Matplot3D4JMgr mgr=new Matplot3D4JMgr(processor);
//===========================================
//дкДЫзМБИЪ§Он
//УПзщЪ§ОндквЛИіЛђЖрИіЖўЮЌЪ§зщжаЃЌЪ§зщжаБэЪОжљЬхИпЖШЃЈБъ1БэЪОзщКХЃЌЯрЭЌзщКХЭЌбеЩЋЃЛЯТБъ2БэЪОЭЌзщжаЕФВЛЭЌСаЃЉ
//prepare your data here
Random ra=new Random();
double[][] ds1 = new double[][] { { 3, 4, 5, 6, 7 }, { 2, 3, 4, 9, 6 }, { 1, 2, 3, 8, 5 } };
double[][] ds2 = new double[][] {
{ 3 + ra.nextDouble(), 4 + ra.nextDouble(), 5 + ra.nextDouble(), 6 + ra.nextDouble(),
7 + ra.nextDouble() },
{ 2 + ra.nextDouble(), 3 + ra.nextDouble(), 4 + ra.nextDouble(), 5 + ra.nextDouble(),
6 + ra.nextDouble() },
{ 1 + ra.nextDouble(), 2 + ra.nextDouble(), 3 + ra.nextDouble(), 4 + ra.nextDouble(),
5 + ra.nextDouble() } };
double[][] ds3 = new double[][] {
{ 3 + ra.nextDouble(), 4 + ra.nextDouble(), 5 + ra.nextDouble(), 6 + ra.nextDouble(),
7 + ra.nextDouble() },
{ 2 + ra.nextDouble(), 3 + ra.nextDouble(), 4 + ra.nextDouble(), 5 + ra.nextDouble(),
6 + ra.nextDouble() },
{ 1 + ra.nextDouble(), 2 + ra.nextDouble(), 3 + ra.nextDouble(), 4 + ra.nextDouble(),
5 + ra.nextDouble() } };
double[][] ds4 = new double[][] {
{ 3 + ra.nextDouble(), 4 + ra.nextDouble(), 5 + ra.nextDouble(), 6 + ra.nextDouble(),
7 + ra.nextDouble() },
{ 2 + ra.nextDouble(), 3 + ra.nextDouble(), 4 + ra.nextDouble(), 5 + ra.nextDouble(),
6 + ra.nextDouble() },
{ 1 + ra.nextDouble(), 2 + ra.nextDouble(), 3 + ra.nextDouble(), 4 + ra.nextDouble(),
5 + ra.nextDouble() } };
double[][] ds5 = new double[][] {
{ 3 + ra.nextDouble(), 4 + ra.nextDouble(), 5 + ra.nextDouble(), 6 + ra.nextDouble(),
7 + ra.nextDouble() },
{ 2 + ra.nextDouble(), 3 + ra.nextDouble(), 4 + ra.nextDouble(), 5 + ra.nextDouble(),
6 + ra.nextDouble() },
{ 1 + ra.nextDouble(), 2 + ra.nextDouble(), 3 + ra.nextDouble(), 4 + ra.nextDouble(),
5 + ra.nextDouble() } };
processor.addData("ЯюФП1", ds1);
processor.addData("ЯюФП2", ds2);
processor.addData("ЯюФП3", ds3);
processor.addData("ЯюФП4", ds4);
processor.addData("ЯюФП5", ds5);
mgr.setTitle("Demo : ЖрВужљзДЭМ");
//ПЩНјааЯрЖдЯпЖШЯдЪОБШР§ЕїећЃЌМДвЛИіТпМГЄЖШПЩвдЖдгІВЛЭЌЕФЯдЪОГЄЖШ
mgr.setScaleZ(8);
mgr.setScaleX(1.2);
mgr.setScaleY(2);
mgr.setSeeta(0.3);//ЙлВьЕФГѕЪМИЉбіНЧ
mgr.setBeita(1.2);//ЙлВьЕФГѕЪМЗНЮЛНЧ
//здЖЈвхЧјБъЧЉЃЌЪ§СПгызщЪ§ЖдгІ
mgr.setRulerLabelsX(new String[] { "AЧј", "BЧј", "CЧј", "DЧј", "EЧј" });
mgr.setRulerLabelsY(new String[] { "2018", "2017", "2016" });
//СаЗНЯђБъЧЉ
mgr.setXName("X_Чјгђ");
mgr.setYName("Y_ФъЗн");
mgr.setZName("Z_жИБъ");
//зјБъЯЕЦНУцПеМфЮЛжУЮШЖЈ
mgr.setCoordianteSysShowType(Matplot3D4JMgr.COORDINATE_SYS_STABLE);
mgr.show();
}
}
?
?