Update: Due to a glitch in my code I miscalculated the difference. It has been updated. See full history of the code in the Gist. The outcome is still essentially the same :)
I was talking with David Fowler when he mentioned something I found surprising: “Lambdas are more efficient than Method Groups”. My initial reaction was that he was entirely wrong, but he explained why and then I decided to do some analysis. Here’s what I found.
I wrote a simple program that would pass a method group in to a method in a big loop:
for (int i = 0; i < Iterations; i++)
{
	Call(Dump);
}
And later on, it tried the same with a simple lambda
for (int i = 0; i < Iterations; i++)
{
	Call(s => Dump(s));
}
Where Call takes an Action<string> and Dump takes a single string argument and just does nothing:
private static void Call(Action<string> act)
{
	act("Hi!");
}

private static void Dump(string str)
{

}
See the full code for the program as a Gist.
I put in some simple Stopwatch-based timing and Console.ReadLine calls to allow me to advance the app through the steps slowly. The results from the Stopwatch (which timed the whole process and took an average) were interesting on their own. I pre-JIT the methods by calling them outside the loops first, and with 100,000,000 iterations, I got this output:
Running Method Group Test
Finished Method Group Test
Elapsed: 1.5171E+006ns
Average: 1.5171E-002ns
High-Precision? Yes
Press Enter to Continue

Running Lambda Test
Finished Lambda Test
Elapsed: 9.9125E+005ns
Average: 9.9125E-003ns
High-Precision? Yes
Press Enter to End
The lambda case is noticibly faster! Note the difference in exponent (we’re dealing with tiny numbers). Ok, so not much faster, but still, that’s a significant result.
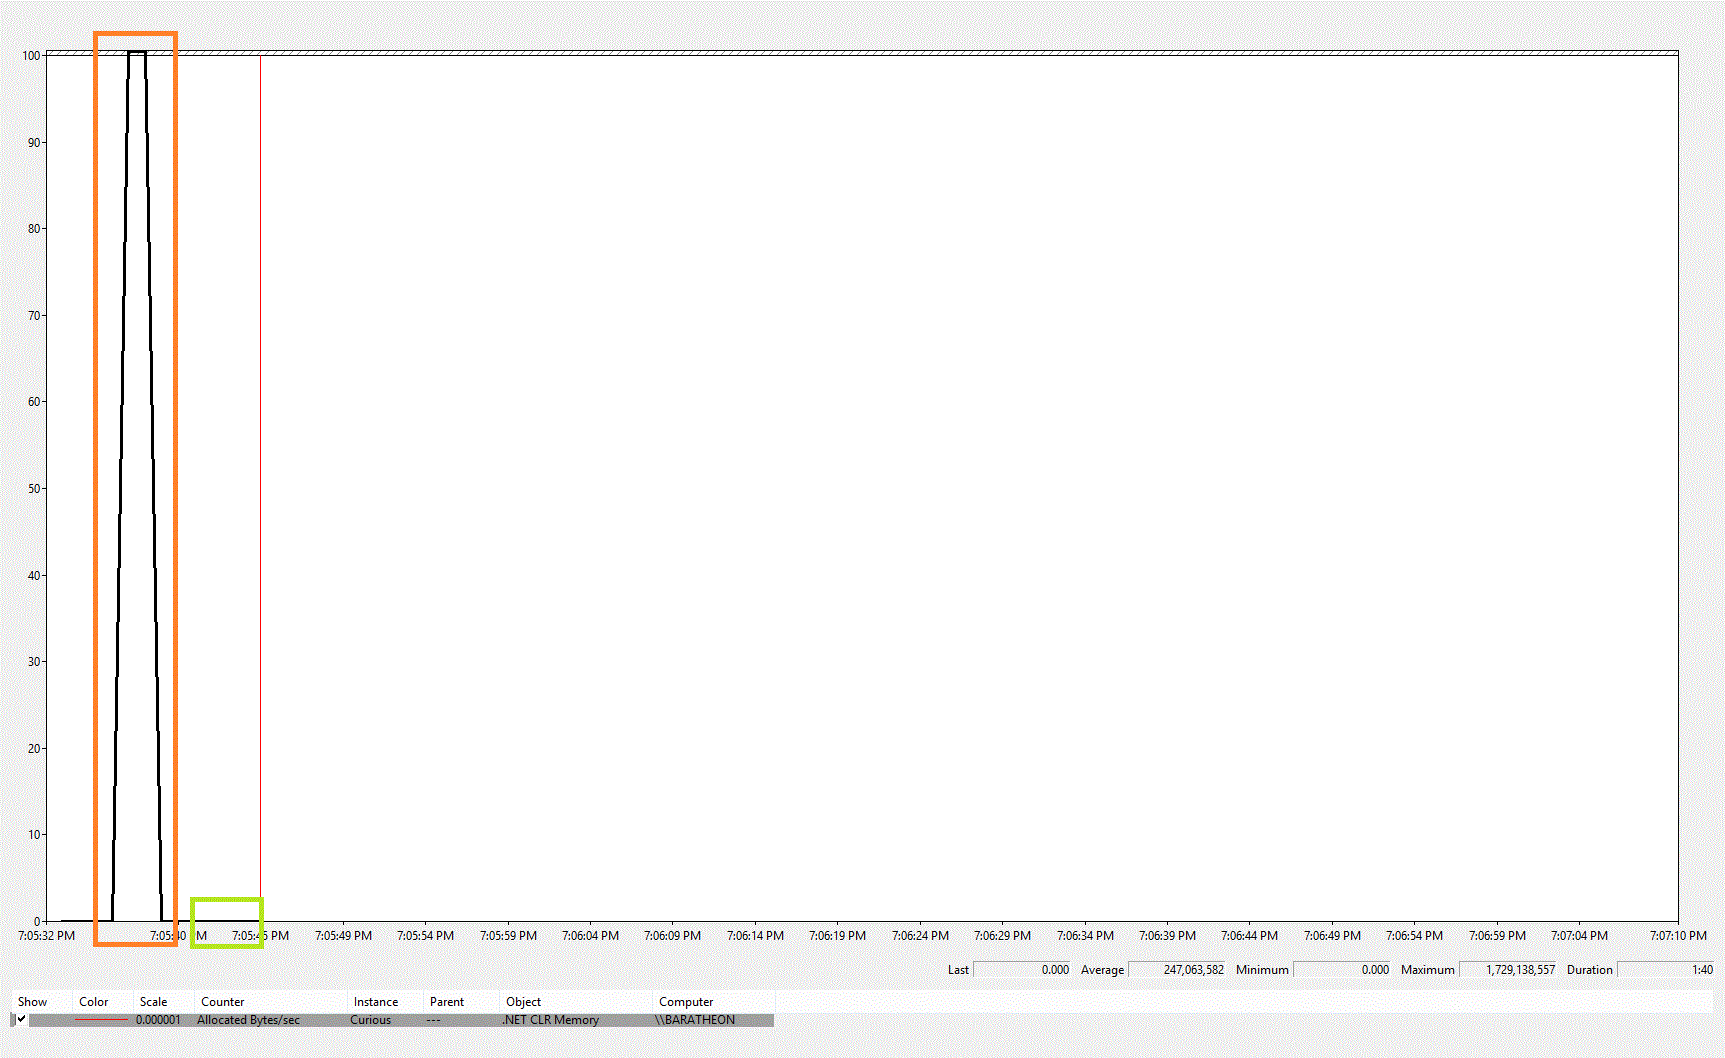
Now, what about memory. So I pulled up perfmon and added the .NET “Allocated Bytes/sec” counter. I’m not sure if that’s the right one, but it certainly seemed to illustrate the point. This is what I saw:

The big spike at the beginning (highlighted in Orange) is the Method Group round. The flat line (highlighted in Green) is the Lambda round. This must be where the problem lies.
Sure enough, looking at the code, we see something interesting. To simplify, I’ve made simple instance methods that just perform the call with a method group and a lambda (see the Gist). Now to decompile them.
.method private hidebysig instance void MethodGroup() cil managed
{
    .maxstack 8
    L_0000: nop
    L_0001: ldnull
    L_0002: ldftn void Curious.Program::Dump(string)
    L_0008: newobj instance void [mscorlib]System.Action`1<string>::.ctor(object, native int)
    L_000d: call void Curious.Program::Call(class [mscorlib]System.Action`1<string>)
    L_0012: nop
    L_0013: ret
}
First the one with the Method Group (above). Hmm… at L_0008 we see that we’re creating a new delegate and putting the function pointer to Dump in. Make sense. So why doesn’t the lambda version create the same amount of memory?
.method private hidebysig instance void Lambda() cil managed
{
    .maxstack 8
    L_0000: nop
    L_0001: ldsfld class [mscorlib]System.Action`1<string> Curious.Program::CS$<>9__CachedAnonymousMethodDelegate5
    L_0006: brtrue.s L_001b
    L_0008: ldnull
    L_0009: ldftn void Curious.Program::<Lambda>b__4(string)
    L_000f: newobj instance void [mscorlib]System.Action`1<string>::.ctor(object, native int)
    L_0014: stsfld class [mscorlib]System.Action`1<string> Curious.Program::CS$<>9__CachedAnonymousMethodDelegate5
    L_0019: br.s L_001b
    L_001b: ldsfld class [mscorlib]System.Action`1<string> Curious.Program::CS$<>9__CachedAnonymousMethodDelegate5
    L_0020: call void Curious.Program::Call(class [mscorlib]System.Action`1<string>)
    L_0025: nop
    L_0026: ret
}
Well, it certainly does more. But the key parts start at L_0001. The first thing this code does is check if the “CS$<>9__CachedAnonymousMethodDelegate5” member has a value. If not, it fills it in, at L_0014. But if it DOES have a value, the code just invokes that cached value! BINGO! The Method Group version allocates a new object every single time it is run whereas the lambda version uses an instance (or static, as necessary) field to cache the delegate.
So, what does this mean for you? Well, probably not much. Notice that all these numbers were tiny, so we’re talking about micro-optimizations. In fact, the most important take-away here is to remember that just because something seems faster, doesn’t mean it is faster. In David’s case, he discovered this in SignalR because they have a non-trivial number of lambdas allocated per connection, and there can be a LOT of connections. I know that I’ll probably switch to using Lambdas, just because it doesn’t seem to have any ill effects and if it saves us a few bytes, why not.
Please do note that I’m no performance expert. If you see a problem in this post, please tell me! It’s possible I’ve gotten this completely wrong somehow, so if this kind of performance is crucial to your app, you should definitely do your own profiling! And remember, the only way to make performance gains is to measure measure measure. You can’t just eyeball perf ;).
refer to:http://vibrantcode.com/2013/02/19/lambdas-vs-method-groups/