?
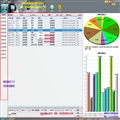
实现需要先下载FusionCharts支持文件,最好使用一个破解版,可以去掉官网打出的一些广告效果;
?
XML数据格式:
?
class="xml" name="code"><?xml version="1.0" encoding="UTF-8"?>
<chart caption="室内外温度监控线性图" yAxisName="温度值" xAxisName="周期"
	bgColor="FF5904,FFFDDD,FFFFFF" bgAlpha="50" bgRatio="40,60,30" bgAngle="180"
	showBorder="1" borderColor="1D8BD1" borderThickness="3" borderAlpha="30"
	numberSuffix="℃">
	<categories>
		<category label="11月份" />
		<category label="11月份" />
		<category label="11月份" />
		<category label="11月份" />
		<category label="11月份" />
		<category label="11月份" />
		<category label="11月份" />
		<category label="11月份" />
		<category label="11月份" />
		<category label="11月份" />
	</categories>
	<dataset seriesName="室内温度" color="1D8BD1" anchorBorderColor="1D8BD1"
		anchorBgColor="F1683C">
		<set value="24" />
		<set value="17" />
		<set value="19" />
		<set value="20" />
		<set value="23" />
		<set value="20" />
		<set value="17" />
		<set value="17" />
		<set value="24" />
		<set value="23" />
	</dataset>
	<dataset seriesName="室外温度" color="F1683C" anchorBorderColor="1D8BD1">
		<set value="15" />
		<set value="7" />
		<set value="12" />
		<set value="5" />
		<set value="15" />
		<set value="5" />
		<set value="5" />
		<set value="15" />
		<set value="9" />
		<set value="11" />
	</dataset>
</chart>
?
?
?
// 创建FunctionCharts MSLine线性图xml模板数据数据
		XmlUtils.buildFunctionChartsMSLineXMLTemplatesData(temperMonitors);
?
?
package cn.sup.cd.common.util;

import java.io.FileNotFoundException;
import java.io.FileOutputStream;
import java.io.IOException;
import java.util.List;

import org.apache.struts2.ServletActionContext;
import org.jdom.Document;
import org.jdom.Element;
import org.jdom.output.XMLOutputter;

import cn.sup.cd.domain.TemperMonitor;

public class XmlUtils {
	/**
	 * 构建FunctionCharts MSLine线性图 XML格式的模板数据
	 * @param list 查询的list数据集合
	 */
	public static void buildFunctionChartsMSLineXMLTemplatesData(List<TemperMonitor> list){

		//创建根节点
		Element chart = new Element("chart");
		//为根节点设置属性
		chart.setAttribute("caption","室内外温度监控线性图");
		//X轴名称
		chart.setAttribute("yAxisName", "温度值");
		//y轴名称
		chart.setAttribute("xAxisName", "周期");
		//背景颜色
		chart.setAttribute("bgColor", "FF5904,FFFDDD,FFFFFF");
		//透明度
		chart.setAttribute("bgAlpha", "50");
		//每种颜色渐变的百分比。总的百分比的和必须是100
		chart.setAttribute("bgRatio", "40,60,30");
		//渐变色的填充角度 (角度: 0-360).
		chart.setAttribute("bgAngle", "180");
		//是否显示边框。2D Chart默认为1,3D Chart默认为0.
		chart.setAttribute("showBorder", "1");
		//边框颜色
		chart.setAttribute("borderColor", "1D8BD1");
		//边框的宽度,以像素为单位
		chart.setAttribute("borderThickness", "3");
		//边框的透明度。
		chart.setAttribute("borderAlpha", "30");

		chart.setAttribute("numberSuffix", "℃");


		//将根节点插入到文档中
		Document doc = new Document(chart);
		//获取xml数据存放位置
		String outputPath = ServletActionContext.getServletContext().getRealPath("/");

		//
		Element categories = new Element("categories");

		//室内温度数据设置
		Element indoor_temper_dataset = new Element("dataset");
		indoor_temper_dataset.setAttribute("seriesName","室内温度");
		indoor_temper_dataset.setAttribute("color","1D8BD1");
		indoor_temper_dataset.setAttribute("anchorBorderColor","1D8BD1");
		indoor_temper_dataset.setAttribute("anchorBgColor","1D8BD1");
		//室外温度数据设置
		Element outdoor_temper_dataset = new Element("dataset");
		outdoor_temper_dataset.setAttribute("seriesName","室外温度");
		outdoor_temper_dataset.setAttribute("color","F1683C");
		outdoor_temper_dataset.setAttribute("anchorBorderColor","1D8BD1");
		indoor_temper_dataset.setAttribute("anchorBgColor","F1683C");


		//此处 for 循环可替换成 遍历 数据库表的结果集操作;
		try {
			if (null != list) {
				for (TemperMonitor temper : list) {

					Element category = new Element("category");
					Element indoor_temper_set = new Element("set");
					Element outdoor_temper_set = new Element("set");

					category.setAttribute("label",temper.getMonitor_cycle());
					//室内温度值设置
					indoor_temper_set.setAttribute("value",String.valueOf(temper.getIndoor_temperature()));
					//室外温度值设置
					outdoor_temper_set.setAttribute("value",String.valueOf(temper.getOutdoor_temperature()));

					//给父节点添加子节点;
					categories.addContent(category);
					indoor_temper_dataset.addContent(indoor_temper_set);
					outdoor_temper_dataset.addContent(outdoor_temper_set);
				}
			}
		} catch (Exception e) {
			e.printStackTrace();
		}
		//将所有节点添加到 根节点
		chart.addContent(categories);
		chart.addContent(indoor_temper_dataset);
		chart.addContent(outdoor_temper_dataset);

		XMLOutputter XMLOut = new XMLOutputter();
		try {
			XMLOut.output(doc, new FileOutputStream(outputPath+"/xmlData/"+"emperMonitorMSLine.xml"));
		} catch (FileNotFoundException e) {
			e.printStackTrace();
		} catch (IOException e) {
			e.printStackTrace();
		}
	}
}
?
?
?
<tr>
   <td colspan="5">
		<div class="graphicsMaxDiv">
			<div class="graphicsShow1" id="graphicsShowDataOne">
			</div>
		</div>
    </td>
</tr>
?
?
$(document).ready(function() {
	$("#graphicsShowDataOne").insertFusionCharts( {
		swfUrl : "/js/FusionCharts/MSLine.swf",
		dataSource : "/xmlData/emperMonitorMSLine.xml",
		dataFormat : "xmlurl",
		width : "580",
		height : "400",
		id : "myChartId"
	});
});
?


![[转]Unicode、UTF-8 和 ISO8859-1到底有什么区别](/Upload/SmallIMG/2013112021/9597622096CCB57A.gif)