这个是很多天之前做的了,当时上级要求做一个报表,内部用的小工具。其中要画折线图,柱状图这些。用了一下JFreeChart,图是做出来了,但是这个效果很不好。直接生成了一张图片展示出来,无法进行交互。百度一下,看到了highcharts,大家评论也不错,生成的图表很酷。
highcharts和easyui很像,都是通过json来传递数据,我们要做的,就是在后台封装前端所需要的数据和格式。
这里说的是Highcharts中的HighStock这个工具,因为做时间图的时候,数据非常多,HighCharts是无法实现那么多的,但是HighStock没问题。
先上前端的代码:
function querygraph(){
    $(function () {
        var chart;
        var ground=$('#cc').combobox('getValue');
        var begin_time=$('#begin_time').datetimebox('getValue');
        var end_time=$('#end_time').datetimebox('getValue');
        $(function(){
            $.ajax({
                type:'POST',
                dataType:'JSON',
                url:'TimeGraph',
                data:"ground="+ground+"&begin_time="+begin_time+"&end_time="+end_time,
                beforeSend: ajaxLoading(),
                    success:function(result){
                        ajaxLoadEnd();
                        $('#container').highcharts('StockChart',{
                        credits:{
                            enabled:false
                        },
                        rangeSelector : {
                                selected : 1
                            },

                        title: { text: result.text, x: -20 },

                        subtitle: {    text:result.subtitle, x: -20},

                         plotOptions: {
                             series:{
                                 turboThreshold:0
                             }
                         },
                         xAxis: {
                                tickPixelInterval: 200,//x轴上的间隔
                            //  title :{
                            //      text:"title"
                            //  },
                                type: 'datetime', //定义x轴上日期的显示格式
                                labels: {
                                formatter: function() {
                                    return  Highcharts.dateFormat('%Y-%m-%d %H:%M:%S', this.value);
                                },
                                align: 'center'
                            }
                            },
                        yAxis: {
                            title: { text: '泊位数量' },
                            //min: 0,
                            minorGridLineWidth: 0,
                            gridLineWidth: 0,
                            alternateGridColor: null,
                             plotBands: [{ // Light air
                                 from: result.begin, to: result.total,
                                 color: 'rgba(255, 0, 0, 0.7)',
                                 label: {
                                     text: '总泊位数:'+result.total,
                                     style: { color: '#606060'
                                         }
                             } }]
                             },
                        series : [{
                            name : '空余数量',
                            data : result.series,
                            tooltip: { valueDecimals: 0 }
                        }]

                    });
            }
            }
            );
        });
    });
    }
主要用的js代码如上,其中首部声明的变量是为了从easyui获取字段数据的。
然后在ajax中请求url,获取json数据。
比较麻烦的是后端数据拼装了。
    public JSONObject getData(String begin_time,String end_time,String ground_code){
        logger.info("ground:"+ground_code+"==");
        logger.info("begin:"+begin_time);
        logger.info("end:"+end_time);
        JSONObject result=new JSONObject();
        String ground_name=reportService.getGroundnameByid(Long.parseLong(ground_code));
        logger.info("groundname:"+ground_name);
        List<Report> list=reportService.getReport(Long.parseLong(ground_code), Timestamp.valueOf(begin_time), Timestamp.valueOf(end_time));
        //数据1,空闲数量
        JSONArray jsonArray2=new JSONArray();
        //数据2,全部
        long total=reportService.getTotalBerth(Long.parseLong(ground_code));
        for (int i = 0; i < list.size(); i++) {
            Report report=list.get(i);
            Date date=report.getRecord_time();
            long time=date.getTime();
            JSONArray jsonArray=new JSONArray();
            jsonArray.add(time);
            jsonArray.add(report.getAvailable_berth_number());
            jsonArray2.add(jsonArray);
        }
        result.put("text", ground_name+" 泊位统计图");
        result.put("subtitle", begin_time+" 到 "+end_time+"之间的统计量");
        result.put("begin", total-0.5);
        result.put("total", total);
        result.put("series",jsonArray2);
        logger.info("result:"+result.toString());
        return result;
    }
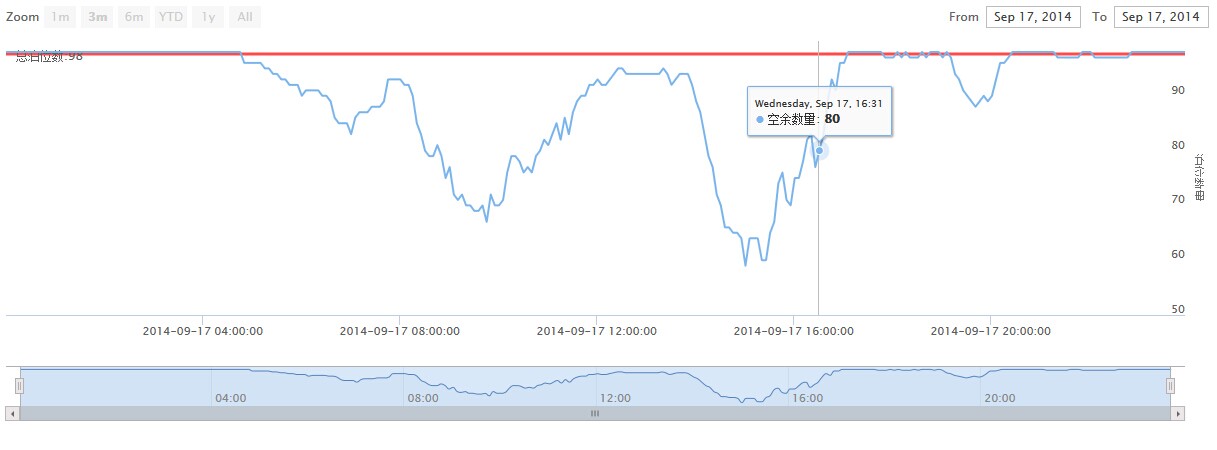
其中,主要的数据是jsonArray2这个,这个类型是[[时间,数据],[时间,数据],...] 。时间是utc时间,如果前后台用的时间不一致的话,其中有一个不是utc时间,那么会造成时差八小时的问题,这个要统一。要么是前端禁用utc时间,要么后台时间也转成utc时间。
效果图如下:
除了这个工具,highcharts默认的那些都很好用,api里面说明也很多。
也做了一个柱状图,数据拼装代码如下:
    public JSONObject getData(String begin_time,String end_time,String ground){
        JSONObject result=new JSONObject();
        Timestamp begin=Timestamp.valueOf(begin_time);
        Timestamp end=Timestamp.valueOf(end_time);
        String ground_name=groundFlowService.getGroundNameById(Long.parseLong(ground));
        List<FlowDaily> list=groundFlowService.getGroundflow(Long.parseLong(ground), begin, end);
        JSONObject categories_json=new JSONObject();
        JSONObject series_json_in=new JSONObject();
        JSONObject series_json_out=new JSONObject();
        JSONArray series_jsonarray=new JSONArray();
        String[] cata=new String[list.size()];
        long[] data_int=new long[list.size()];
        long[] data_out=new long[list.size()];
        //驶入量
        series_json_in.put("name", "驶入量");
        series_json_out.put("name", "驶出量");
        for (int i = 0; i < data_int.length; i++) {
            FlowDaily flowDaily=list.get(i);
            data_int[i]=flowDaily.getIncount();
            data_out[i]=flowDaily.getOutcount();
            cata[i]=flowDaily.getStat_date().toString().substring(0, 10);
        }
        series_json_in.put("data", data_int);
        series_json_out.put("data", data_out);
        categories_json.put("categories", cata);
        series_jsonarray.add(series_json_in);
        series_jsonarray.add(series_json_out);
        result.put("text", ground_name+" 柱状统计图");
        result.put("subtitle", begin_time+" 到 "+end_time+"之间的统计量");
        result.put("categories", categories_json);
        result.put("series", series_jsonarray);
        /*拼接的结果格式
         * categories: ['Apples', 'Oranges', 'Pears', 'Grapes', 'Bananas']
         *     series: [{ name: 'John', data: [5, 3, 4, 7, 2] },
                    { name: 'Jane', data: [2, -2, -3, 2, 1] },
                    { name: 'Joe', data: [3, 4, 4, -2, 5] }] */
        logger.info(result);
        return result;
    }