jstat工具可以详细的显示出HotSpot VM的性能信息.
目前Sun JDK和OpenJDK中均使用了HotSpot技术,即热点代码探测技术。通过执行计数器找出最具有编译价值的代码,然后通知JIT编译器以方法为单位进行编译。如果一个方法被频繁调用,或方法中有效
循环次数很多,将会分别触发标准编译和OSR(栈上替换)编译动作。通过编译器与解释器恰当地协同工作,可以在最优化的程序响应时间与最佳执行性能中取得平衡,而且无须等待本地代码输出才能执行程序,即时编译的时间压力也相对减小,这样有助于引入更多的代码优化技术,输出质量更高的本地代码。
详细的参数及含义见本文结尾的参考文献3.
例如:1. 查看
使用说明
jstat -help
Usage: jstat -help|-options
jstat -<option> [-t] [-h<lines>] <vmid> [<interval> [<count>]]
Definitions:
<option> An option reported by the -options option
<vmid> Virtual Machine Identifier. A vmid takes the following form:
<lvmid>[@<hostname>[:<port>]]
Where <lvmid> is the local vm identifier for the target
Java virtual
machine, typically a process id; <hostname> is
the name of the host running the target Java virtual machine;
and <port> is the port number for the rmiregistry on the
target host. See the jvmstat documentation for a more complete
description of the Virtual Machine Identifier.
<lines> Number of samples between
header lines.
<interval> Sampling interval. The following forms are allowed:
<n>["ms"|"s"]
Where <n> is an integer and the suffix specifies the units as
milliseconds("ms") or seconds("s"). The default units are "ms".
<count> Number of samples to take before terminating.
-J<flag> Pass <flag> directly to the runtime
system.
例如2. 查看可用参数
jstat -options
-
class
-compiler
-gc
-gccapacity
-gccause
-gcnew
-gcnewcapacity
-gcold
-gcoldcapacity
-gcpermcapacity
-gcutil
-printcompilation
例如:3. gc统计的摘要. 每10秒显示一次,显示5次.
jstat -gcutil pid 10000 5
或者
jstat -gcutil pid 10s 5
结果:
S0 S1 E O P YGC YGCT FGC FGCT GCT
50.00 0.00 85.00 90.19 75.27 154722 515.577 740 63.594 579.171
0.00 25.00 83.56 90.23 75.27 154723 515.582 740 63.594 579.176
25.00 0.00 68.09 90.28 75.27 154724 515.586 740 63.594 579.180
0.00 75.00 51.18 90.38 75.27 154725 515.590 740 63.594 579.184
50.00 0.00 34.47 90.47 75.27 154726 515.594 740 63.594 579.188
其中参数的含义:
S0: Survivor space 0, S0区使用量/S0区容量=S0区使用率.
S1: Survivor space 1, S1区使用量/S1区容量=S1区使用率.
E: Eden space, Eden区使用量/Eden区容量=Eden区使用率.
O: Old space, Old区使用量/Old区容量=Old区使用率.
P: Permanent space, Permanent区使用量/Permanent区容量=Permanent区使用率.
YGC: Young generation GC events, Young GC次数.
YGCT: Young generation garbage collection time, Young GC时间(毫秒).
FGC: Number of full GC events, Full GC次数.
FGCT: Full garbage collection time, Full GC时间(毫秒).
GCT: Total garbage collection time, 总GC时间(毫秒).
注:在New Generation块中,一般进行Younc GC垃圾回收,采用Copying的
算法,速度快。每次GC的时候,存活下来的对象首先由Eden拷贝到某个Survivor Space, 当Survivor Space空间满了后, 剩下的live对象就被直接拷贝到Old Generation中去。因此,每次GC后,Eden
内存块会被清空。
具体的
例子如下.
S0 S1 E O P YGC YGCT FGC FGCT GCT
21.72 0.00 23.83 82.26 38.02 813360 47227.030 40 12.181 47239.211
21.72 0.00 32.21 82.26 38.02 813360 47227.030 40 12.181 47239.211
21.72 0.00 42.84 82.26 38.02 813360 47227.030 40 12.181 47239.211
21.72 0.00 52.90 82.26 38.02 813360 47227.030 40 12.181 47239.211
21.72 0.00 60.76 82.26 38.02 813360 47227.030 40 12.181 47239.211
21.72 0.00 69.49 82.26 38.02 813360 47227.030 40 12.181 47239.211
21.72 0.00 77.63 82.26 38.02 813360 47227.030 40 12.181 47239.211
21.72 0.00 85.47 82.26 38.02 813360 47227.030 40 12.181 47239.211
21.72 0.00 92.54 82.26 38.02 813360 47227.030 40 12.181 47239.211
21.72 13.03 100.00 82.26 38.02 813361 47227.030 40 12.181 47239.211
0.00 16.59 9.18 82.26 38.02 813361 47227.091 40 12.181 47239.272
0.00 16.59 19.23 82.26 38.02 813361 47227.091 40 12.181 47239.272
0.00 16.59 24.48 82.26 38.02 813361 47227.091 40 12.181 47239.272
0.00 16.59 33.70 82.26 38.02 813361 47227.091 40 12.181 47239.272
0.00 16.59 44.49 82.26 38.02 813361 47227.091 40 12.181 47239.272
0.00 16.59 64.78 82.26 38.02 813361 47227.091 40 12.181 47239.272
0.00 16.59 85.11 82.26 38.02 813361 47227.091 40 12.181 47239.272
21.34 0.00 5.14 82.26 38.02 813362 47227.152 40 12.181 47239.334
21.34 0.00 24.11 82.26 38.02 813362 47227.152 40 12.181 47239.334
21.34 0.00 44.38 82.26 38.02 813362 47227.152 40 12.181 47239.334
21.34 0.00 61.60 82.26 38.02 813362 47227.152 40 12.181 47239.334
过程:使用Eden/S0/S1三个分区
算法过程:[见参考4]
1). Eden+S0可分配新生对象;
2). 对Eden+S0进行垃圾收集,存活对象复制到S1。清理Eden+S0。一次新生代GC结束。
3). Eden+S1可分配新生对象;
4). 对Eden+S1进行垃圾收集,存活对象复制到S0。清理Eden+S1。二次新生代GC结束。
5). goto 1。
例如4. 监控类加载情况
jstat -class pid 10000 5
Loaded Bytes Unloaded Bytes Time
2130 4228.4 5 8.4 1.97
2130 4228.4 5 8.4 1.97
2130 4228.4 5 8.4 1.97
2130 4228.4 5 8.4 1.97
2130 4228.4 5 8.4 1.97
Loaded: 加载的类的数量
Bytes:加载的类所占的空间
Unloaded:
卸载的类的数量
Bytes:卸载的类占用的空间
Time:操作所消耗的时间(毫秒)
例如5. 监控类编译情况
jstat -compiler pid 10000 5
Compiled Failed Invalid Time FailedType FailedMethod
643 0 0 12.11 0
643 0 0 12.11 0
643 0 0 12.11 0
643 0 0 12.11 0
643 0 0 12.11 0
Compiled: 实时编译的数量
Failed:失败的数量
Invalid:无效的数量
Time:消耗的时间(毫秒)
FailedType:失败的类型数
FailedMethod:失败的方法数
例如6. 监控堆内存heap的gc情况
jstat -gc 15959 10000 5
S0C S1C S0U S1U EC EU OC OU PC PU YGC YGCT FGC FGCT GCT
128.0 128.0 0.0 64.0 2432.0 2364.8 17600.0 15941.8 21248.0 15995.2 154895 516.259 741 63.692 579.951
128.0 128.0 64.0 0.0 2432.0 2104.9 17600.0 15957.8 21248.0 15995.2 154896 516.263 741 63.692 579.955
128.0 128.0 0.0 96.0 2432.0 1664.5 17600.0 15973.8 21248.0 15995.2 154897 516.265 741 63.692 579.957
128.0 128.0 64.0 0.0 2432.0 1309.9 17600.0 15989.8 21248.0 15995.2 154898 516.268 741 63.692 579.960
128.0 128.0 0.0 32.0 2432.0 941.3 17600.0 15997.8 21248.0 15995.2 154899 516.272 741 63.692 579.964
S0C: Survivor space 0 Capacity, 当前survivor区0的容量(KB)
S1C: Survivor space 1 Capacity, 当前survivor区1的容量(KB)
S0U: Survivor space 0 Utilzation, survivor区0的使用量(KB)
S1U: Survivor space 1 Utilzation, survivor区1的使用量(KB)
EC: Eden space Capacity, 当前eden区的容量(KB)
EU: Eden space Utilzation, 当前eden区的使用量(KB)
OC: Old space Capacity, 当前old区的容量(KB)
OU: Old space Utilzation, 当前old区的使用量(KB)
PC, Permanent space Capacity, 当前permanent区的容量(KB)
PU, Permanent space Capacity, 当前permanent区的使用量(KB)
YGC: Young Generation Garbage Collection events, Young GC次数
YGCT: Young Generation Garbage Collection Time, Young GC时间(毫秒)
FGC: Full Garbage Collection events, Full GC次数
FGCT: Full Garbage Collection Time, Full GC时间(毫秒)
GCT: total Garbage Collection Time, 总的GC时间(毫秒)
具体过程和例子3是一致的, 详细的例子如下.
S0C S1C S0U S1U EC EU OC OU PC PU YGC YGCT FGC FGCT GCT
128.0 128.0 0.0 32.0 2432.0 390.5 16768.0 15175.2 21248.0 15992.6 155419 518.181 744 63.984 582.165
128.0 128.0 0.0 32.0 2432.0 796.7 16768.0 15175.2 21248.0 15992.6 155419 518.181 744 63.984 582.165
128.0 128.0 0.0 32.0 2432.0 1230.3 16768.0 15175.2 21248.0 15992.6 155419 518.181 744 63.984 582.165
128.0 128.0 0.0 32.0 2432.0 1648.7 16768.0 15175.2 21248.0 15992.6 155419 518.181 744 63.984 582.165
128.0 128.0 0.0 32.0 2432.0 1663.0 16768.0 15175.2 21248.0 15992.6 155419 518.181 744 63.984 582.165
128.0 128.0 0.0 32.0 2432.0 2067.7 16768.0 15175.2 21248.0 15992.6 155419 518.181 744 63.984 582.165
128.0 128.0 96.0 0.0 2432.0 404.7 16768.0 15191.2 21248.0 15992.6 155420 518.184 744 63.984 582.168
128.0 128.0 96.0 0.0 2432.0 838.4 16768.0 15191.2 21248.0 15992.6 155420 518.184 744 63.984 582.168
128.0 128.0 96.0 0.0 2432.0 1244.7 16768.0 15191.2 21248.0 15992.6 155420 518.184 744 63.984 582.168
128.0 128.0 96.0 0.0 2432.0 1661.9 16768.0 15191.2 21248.0 15992.6 155420 518.184 744 63.984 582.168
128.0 128.0 96.0 0.0 2432.0 1723.3 16768.0 15191.2 21248.0 15992.6 155420 518.184 744 63.984 582.168
128.0 128.0 96.0 0.0 2432.0 2067.5 16768.0 15191.2 21248.0 15992.6 155420 518.184 744 63.984 582.168
128.0 128.0 0.0 64.0 2432.0 432.0 16768.0 15207.2 21248.0 15992.6 155421 518.188 744 63.984 582.172
128.0 128.0 0.0 64.0 2432.0 838.3 16768.0 15207.2 21248.0 15992.6 155421 518.188 744 63.984 582.172
128.0 128.0 0.0 64.0 2432.0 1244.6 16768.0 15207.2 21248.0 15992.6 155421 518.188 744 63.984 582.172
128.0 128.0 0.0 64.0 2432.0 1660.9 16768.0 15207.2 21248.0 15992.6 155421 518.188 744 63.984 582.172
128.0 128.0 0.0 64.0 2432.0 1761.2 16768.0 15207.2 21248.0 15992.6 155421 518.188 744 63.984 582.172
128.0 128.0 0.0 64.0 2432.0 2094.2 16768.0 15207.2 21248.0 15992.6 155421 518.188 744 63.984 582.172
128.0 128.0 64.0 0.0 2432.0 404.7 16768.0 15223.2 21248.0 15992.6 155422 518.191 744 63.984 582.175
128.0 128.0 64.0 0.0 2432.0 811.0 16768.0 15223.2 21248.0 15992.6 155422 518.191 744 63.984 582.175
例如7. 监控gc中每一代的最大值和使用情况
stat -gccapacity pid 10000 5
NGCMN NGCMX NGC S0C S1C EC OGCMN OGCMX OGC OC PGCMN PGCMX PGC PC YGC FGC
21120.0 337920.0 2688.0 128.0 128.0 2432.0 42240.0 675840.0 17600.0 17600.0 21248.0 83968.0 21248.0 21248.0 154902 741
21120.0 337920.0 2688.0 128.0 128.0 2432.0 42240.0 675840.0 17600.0 17600.0 21248.0 83968.0 21248.0 21248.0 154902 741
21120.0 337920.0 2688.0 128.0 128.0 2432.0 42240.0 675840.0 17600.0 17600.0 21248.0 83968.0 21248.0 21248.0 154903 741
21120.0 337920.0 2688.0 128.0 128.0 2432.0 42240.0 675840.0 17600.0 17600.0 21248.0 83968.0 21248.0 21248.0 154904 741
21120.0 337920.0 2688.0 128.0 128.0 2432.0 42240.0 675840.0 17600.0 17600.0 21248.0 83968.0 21248.0 21248.0 154905 741
NGCMN: New Generation Capacity MiNimum, 新生代容量的最小值(KB)
NGCMX: New Generation Capacity MaXimum, 新生代容量的最大值(KB)
NGC: New Generation Capacity, 新生代容量的当前值(KB)
S0C: Survivor space 0 Capacity, 当前survivor区0的容量(KB)
S1C: Survivor space 1 Capacity, 当前survivor区1的容量(KB)
EC: Eden space Capacity, 当前eden区的容量(KB)
OGCMN: Old Generation Capacity MiNimum, old代容量的最小值(KB)
OGCMX: Old Generation Capacity MaXimum, old代容量的最大值(KB)
OGC: Old Generation Capacity, old代容量的当前值(KB)
OC: Old space Capacity, old区容量的当前值(KB)
PGCMN: Permanent Generation Capacity MiNimum, 持久代容量的最小值(KB)
PGCMX: Permanent Generation Capacity MaXimum, 持久代容量的最大值(KB)
PGC: Permanent Generation Capacity, 持久代容量的当前值(KB)
PC: Permanent space Capacity, 持久代容量的当前值(KB)
YGC: Young Generation Garbage Collection events, Young GC次数
FGC: Full Garbage Collection events, Full GC次数
问题:为什么NGC可以小于NGCMN?
例如8. 监控GC原因. 在gcutil后加上gc原因列.
jstat -gccause pid 10000 5
S0 S1 E O P YGC YGCT FGC FGCT GCT LGCC GCC
0.00 50.00 68.24 91.44 75.28 154907 516.298 741 63.692 579.990 unknown GCCause No GC
50.00 0.00 51.18 91.53 75.28 154908 516.301 741 63.692 579.994 unknown GCCause No GC
0.00 50.00 34.47 91.62 75.28 154909 516.305 741 63.692 579.997 unknown GCCause No GC
50.00 0.00 16.64 91.71 75.28 154910 516.308 741 63.692 580.001 unknown GCCause No GC
50.00 0.00 84.97 91.71 75.28 154910 516.308 741 63.692 580.001 unknown GCCause No GC
S0: Survivor space 0, S0区使用量/S0区容量=S0区使用率.
S1: Survivor space 1, S1区使用量/S1区容量=S1区使用率.
E: Eden space, Eden区使用量/Eden区容量=Eden区使用率.
O: Old space, Old区使用量/Old区容量=Old区使用率.
P: Permanent space, Permanent区使用量/Permanent区容量=Permanent区使用率.
YGC: Young generation GC events, Young GC次数.
YGCT: Young generation garbage collection time, Young GC时间(毫秒).
FGC: Number of full GC events, Full GC次数.
FGCT: Full garbage collection time, Full GC时间(毫秒).
GCT: Total garbage collection time, 总GC时间(毫秒).
LGCC: Last Garbage Collection Cause, 上次GC原因.
GCC: Garbage Collection Cause, 本次GC原因.
例如9. 监控新生代new generation的GC情况
jstat -gcnew pid 10000 5
S0C S1C S0U S1U TT MTT DSS EC EU YGC YGCT
128.0 128.0 64.0 0.0 1 15 128.0 2432.0 2065.1 154912 516.316
128.0 128.0 0.0 64.0 1 15 128.0 2432.0 2063.0 154913 516.319
128.0 128.0 64.0 0.0 1 15 128.0 2432.0 1655.0 154914 516.323
128.0 128.0 0.0 64.0 1 15 128.0 2432.0 1220.5 154915 516.327
128.0 128.0 64.0 0.0 1 15 128.0 2432.0 814.0 154916 516.331
S0C: Survivor space 0 Capacity, 当前survivor区0的容量(KB)
S1C: Survivor space 1 Capacity, 当前survivor区1的容量(KB)
S0U: Survivor space 0 Utilzation, survivor区0的使用量(KB)
S1U: Survivor space 1 Utilzation, survivor区1的使用量(KB)
TT:
Tenuring Threshold, 存活次数. 达到最大存活次数后,才能晋升到旧生代(Old Generation)
MTT: Maximum Tenuring Thershold, 最大存活次数.
DSS: Desired Survivor Size (KB), 期望存活大小(KB)
EC: Eden space Capacity, 当前eden区的容量(KB)
EU: Eden space Utilzation, 当前eden区的使用量(KB)
YGC: Young Generation Garbage Collection events, Young GC次数
YGCT: Young Generation Garbage Collection Time, Young GC时间(毫秒)
例如10. 监控新生代new generation的最大值和使用情况
jstat -gcnewcapacity pid 10000 5
NGCMN NGCMX NGC S0CMX S0C S1CMX S1C ECMX EC YGC FGC
21120.0 337920.0 2688.0 128.0 112640.0 112640.0 128.0 337792.0 2432.0 154918 741
21120.0 337920.0 2688.0 128.0 112640.0 112640.0 128.0 337792.0 2432.0 154919 741
21120.0 337920.0 2688.0 128.0 112640.0 112640.0 128.0 337792.0 2432.0 154920 741
21120.0 337920.0 2688.0 128.0 112640.0 112640.0 128.0 337792.0 2432.0 154921 741
21120.0 337920.0 2688.0 128.0 112640.0 112640.0 128.0 337792.0 2432.0 154922 741
NGCMN: New Generation Capacity MiNimum, 新生代容量最小值(KB).
NGCMX: New Generation Capacity MaXimum, 新生代容量最大值(KB).
NGC: New Generation Capacity, 新生代容量当前值(KB).
S0CMX: Survivor space 0 Capacity MaXimum, 生存区0容量的最大值(KB).
S0C: Survivor space 0 Capacity, 生存区0容量(KB).
S1CMX: Survivor space 1 Capacity MaXimum, 生存区1容量的最大值(KB).
S1C: Survivor space 1 Capacity, 生存区1容量(KB).
ECMX: Eden space Capacity MaXimum, Eden区容量的最大值(KB).
EC: Eden Capacity, Eden区容量的当前值(KB).
YGC: Young generation GC events, Young GC次数.
FGC: Number of full GC events, Full GC次数.
问题:为什么S0CMX可以比S0C小?
例如11. 监控old代和持久代permanent的GC情况
jstat -gcold pid 10000 5
PC PU OC OU YGC FGC FGCT GCT
21248.0 15995.2 17600.0 16333.8 154923 741 63.692 580.047
21248.0 15995.2 17600.0 16349.8 154924 741 63.692 580.050
21248.0 15995.2 17600.0 16365.8 154925 741 63.692 580.054
21248.0 15995.2 17600.0 16381.8 154926 741 63.692 580.057
21248.0 15995.2 17600.0 16381.8 154926 741 63.692 580.057
PC: Permanent space Capacity, 持久区当前容量(KB).
PU: Permanent space Utilzation, 持久区使用量(KB).
OC: Old space Capacity, Old区当前容量(KB)
OU: Old space Utilzation, Old区使用量(KB)
YGC: Young generation GC events, Young GC次数.
FGC: Number of full GC events, Full GC次数.
FGCT: Full garbage collection time, Full GC时间(毫秒).
GCT: total Garbage Collection Time, 总的GC时间(毫秒)
例如12. 监控old代的最大值和使用情况
jstat -gcoldcapacity pid 10000 5
OGCMN OGCMX OGC OC YGC FGC FGCT GCT
42240.0 675840.0 17600.0 17600.0 154928 741 63.692 580.064
42240.0 675840.0 17600.0 17600.0 154929 741 63.692 580.068
42240.0 675840.0 17600.0 17600.0 154929 741 63.692 580.068
42240.0 675840.0 17600.0 17600.0 154930 741 63.692 580.072
42240.0 675840.0 17600.0 17600.0 154931 741 63.692 580.075
OGCMN: Old Generation Capacity MiNimum, 老生代容量最小值(KB).
OGCMX: Old Generation Capacity MaXimum, 老生代容量最大值(KB).
OGC: Old Generation Capacity, 老生代容量当前值(KB).
OC: Old space Capacity, 老生区当前容量(KB)
YGC: Young generation GC events, Young GC次数.
FGC: Number of full GC events, Full GC次数.
FGCT: Full garbage collection time, Full GC时间(毫秒).
GCT: total Garbage Collection Time, 总的GC时间(毫秒)
例如13. 监控持久代permanent的最大值和使用情况
jstat -gcpermcapacity pid 10000 5
PGCMN PGCMX PGC PC YGC FGC FGCT GCT
21248.0 83968.0 21248.0 21248.0 154933 741 63.692 580.083
21248.0 83968.0 21248.0 21248.0 154934 741 63.692 580.086
21248.0 83968.0 21248.0 21248.0 154935 741 63.692 580.090
21248.0 83968.0 21248.0 21248.0 154935 741 63.692 580.090
21248.0 83968.0 21248.0 21248.0 154936 741 63.692 580.094
PGCMN: Permanent Generation Capacity MiNimum, 持久代容量最小值(KB).
PGCMX: Permanent Generation Capacity MaXimum, 持久代容量最大值(KB).
PGC: Permanent Generation Capacity, 持久代容量当前值(KB).
PC: Permanent space Capacity, 持久区容量当前值(KB).
YGC: Young generation GC events, Young GC次数.
FGC: Number of full GC events, Full GC次数.
FGCT: Full garbage collection time, Full GC时间(毫秒).
GCT: total Garbage Collection Time, 总的GC时间(毫秒)
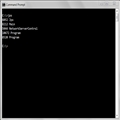
例如14. 监控HotSpot的实时编译情况
jstat -printcompilation pid 10000 5
Compiled Size Type Method
643 754 1 org/apache/logging/log4j/core/appender/rolling/
DefaultRolloverStrategy purgeAscending
643 754 1 org/apache/logging/log4j/core/appender/rolling/DefaultRolloverStrategy purgeAscending
643 754 1 org/apache/logging/log4j/core/appender/rolling/DefaultRolloverStrategy purgeAscending
643 754 1 org/apache/logging/log4j/core/appender/rolling/DefaultRolloverStrategy purgeAscending
643 754 1 org/apache/logging/log4j/core/appender/rolling/DefaultRolloverStrategy purgeAscending
Compiled: 编译的任务数
Size: 方法的bytecode的bytes数
Type: 编译类型
Method: 编译的方法对应的类型和方法名.
参考文献:
1. Sun HotSpot VM
2. Java SE 7: Reviewing
JVM Performance Command Line Tools
3. jstat - Java Virtual Machine Statistics Monitoring Tool
4. JVM中的垃圾收集算法和Heap分区简记