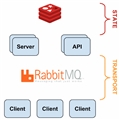
Sensu Server端包含以下几个必须的模块
RabbitMQ
Redis
Sensu Server
Sensu API
他们可以安装在不同的服务器组成集群,也可以装成单机版。
另外还有一个可选模块,管理UI
Uchiwa
监控数据显示UI
grafana
Sensu的安装过程官方文档已经比较齐全,按此安装过程也比较顺利,这里只是记录安装过程中出现的问题和解决办法。
1. 安装过程需要root权限,可以用sudo
但某些命令sudo可能要报错,如:
?
class="bash">sudo echo "deb http://www.rabbitmq.com/debian/ testing main" > /etc/apt/sources.list.d/rabbitmq.list
?
这种需要换成:
?
echo "deb http://www.rabbitmq.com/debian/ testing main" | sudo tee /etc/apt/sources.list.d/rabbitmq.list
?
2. sensu的组件比较多,一个统一的启动脚本:
/etc/init.d/sensu
会比较方便
/etc/init.d/redis-server $1
/etc/init.d/rabbitmq-server $1
/etc/init.d/sensu-server $1
/etc/init.d/sensu-client $1
/etc/init.d/sensu-api $1
/etc/init.d/uchiwa $1
influxDB是一个go语言写的时序数据库,非常适合存储监控计量数据。
InfluxDB安装非常简单,按照官方文档即可顺利安装
接下来访问
http://127.0.0.1:8083
看是否正常
然后在sensu里加入influxdb的handler
https://github.com/sensu/sensu-community-plugins/blob/master/handlers/metrics/influxdb-metrics.rb
并配置好influxdb
https://github.com/sensu/sensu-community-plugins/blob/master/handlers/metrics/influxdb-metrics.json
Grafana是一组纯前端的,专门为监控计量数据展示设计的页面,可以直接从influxdb获取数据展示。
由于Grafana全部是静态的页面,只需要放到一个目录,然后将该目录作为Web服务器的虚拟目录即可。
例如:apache服务器
在/etc/apache2/sites-available/目录添加一个配置文件
grafana-demo.conf
内容:
Listen 8012
<VirtualHost *:8012>
        # The ServerName directive sets the request scheme, hostname and port that
        # the server uses to identify itself. This is used when creating
        # redirection URLs. In the context of virtual hosts, the ServerName
        # specifies what hostname must appear in the request's Host: header to
        # match this virtual host. For the default virtual host (this file) this
        # value is not decisive as it is used as a last resort host regardless.
        # However, you must set it for any further virtual host explicitly.
        #ServerName www.example.com

        ServerAdmin webmaster@localhost
        DocumentRoot /home/sensu/grafana

        # Available loglevels: trace8, ..., trace1, debug, info, notice, warn,
        # error, crit, alert, emerg.
        # It is also possible to configure the loglevel for particular
        # modules, e.g.
        #LogLevel info ssl:warn

        ErrorLog ${APACHE_LOG_DIR}/error.log
        CustomLog ${APACHE_LOG_DIR}/access.log combined

        # For most configuration files from conf-available/, which are
        # enabled or disabled at a global level, it is possible to
        # include a line for only one particular virtual host. For example the
        # following line enables the CGI configuration for this host only
        # after it has been globally disabled with "a2disconf".
        #Include conf-available/serve-cgi-bin.conf
</VirtualHost>

# vim: syntax=apache ts=4 sw=4 sts=4 sr noet
?
并在/etc/apache2/sites-enabled做一个软链接
# ln -s /etc/apache2/sites-available/grafana-demo.conf /etc/apache2/sites-enabled/grafana-demo.conf
注意修改apache.conf
<Directory />
        Options Indexes FollowSymLinks
        #Options FollowSymLinks
        AllowOverride None
        #Require all denied
        Require all granted
</Directory>
?
这样外部才可以访问到
然后修改grafana配置文件:config.js
JSON">      datasources: {
        influxdb: {
          type: 'influxdb',
          url: "http://127.0.0.1:8086/db/demo",
          username: 'root',
          password: 'root',
        },
        grafana: {
          type: 'influxdb',
          url: "http://127.0.0.1:8086/db/grafana",
          username: 'root',
          password: 'root',
          grafanaDB: true
        },
      },
?
访问
http://127.0.0.1:8012
看是否正常
最后可以加一个metric的plugin,如:http://sensuapp.org/docs/0.16/adding_a_metric
并设置handler为influxdb。
到influxdb的管理界面:http://127.0.0.1:8083,Explor db的data,执行list series,就可以看到你的series,最后到grafana的页面配置该series即可看到监控曲线