在开发的过程中,可能会遇到柱状图、饼状图、折线图来更好的显示数据,最近整理了一下,遂放出来望需要的朋友可以参考。本文仅仅是简单显示,如需复杂显示效果请参考官网代码示例。----本文代码使用WPF,Silverlight类似代码,使用第三方wpf_visifire_v5.1.2-0_trial控件。
后续会放上Html5示例。
代码下载地址:代码下载
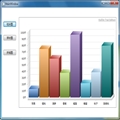
先放上一组截图吧:


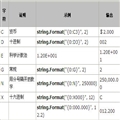
公共数据:
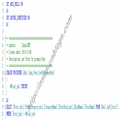
class="brush:csharp;gutter:true;">private List<string> strListx = new List<string>() { "苹果", "樱桃", "菠萝", "香蕉", "榴莲", "葡萄", "桃子", "猕猴桃" };
        private List<string> strListy = new List<string>() { "13", "75", "60", "38", "97", "22", "39", "80" };

        private List<DateTime> LsTime = new List<DateTime>()
            {
               new DateTime(2012,1,1),
               new DateTime(2012,2,1),
               new DateTime(2012,3,1),
               new DateTime(2012,4,1),
               new DateTime(2012,5,1),
               new DateTime(2012,6,1),
               new DateTime(2012,7,1),
               new DateTime(2012,8,1),
               new DateTime(2012,9,1),
               new DateTime(2012,10,1),
               new DateTime(2012,11,1),
               new DateTime(2012,12,1),
            };
        private List<string> cherry = new List<string>() { "33", "75", "60", "98", "67", "88", "39", "45", "13", "22", "45", "80" };
        private List<string> pineapple = new List<string>() { "13", "34", "38", "12", "45", "76", "36", "80", "97", "22", "76", "39" };
柱状图:
 logs_code_hide('4dbcf13c-90f1-4c04-bc5e-c3de46f9b4ae',event)" src="/Upload/Images/2013110618/2B1B950FA3DF188F.gif" alt="" />
public void CreateChartColumn(string name, List<string> valuex, List<string> valuey)
        {
            //创建一个图标
            Chart chart = new Chart();

            //设置图标的宽度和高度
            chart.Width = 580;
            chart.Height = 380;
            chart.Margin = new Thickness(100, 5, 10, 5);
            //是否启用打印和保持图片
            chart.ToolBarEnabled = false;

            //设置图标的属性
            chart.ScrollingEnabled = false;//是否启用或禁用滚动
            chart.View3D = true;//3D效果显示

            //创建一个标题的对象
            Title title = new Title();

            //设置标题的名称
            title.Text = Name;
            title.Padding = new Thickness(0, 10, 5, 0);

            //向图标添加标题
            chart.Titles.Add(title);

            Axis yAxis = new Axis();
            //设置图标中Y轴的最小值永远为0
            yAxis.AxisMinimum = 0;
            //设置图表中Y轴的后缀
            yAxis.Suffix = "斤";
            chart.AxesY.Add(yAxis);

            // 创建一个新的数据线。
            DataSeries dataSeries = new DataSeries();

            // 设置数据线的格式
            dataSeries.RenderAs = RenderAs.StackedColumn;//柱状Stacked


            // 设置数据点
            DataPoint dataPoint;
            for (int i = 0; i < valuex.Count; i++)
            {
                // 创建一个数据点的实例。
                dataPoint = new DataPoint();
                // 设置X轴点
                dataPoint.AxisXLabel = valuex[i];
                //设置Y轴点
                dataPoint.YValue = double.Parse(valuey[i]);
                //添加一个点击事件
                dataPoint.MouseLeftButtonDown += new MouseButtonEventHandler(dataPoint_MouseLeftButtonDown);
                //添加数据点
                dataSeries.DataPoints.Add(dataPoint);
            }

            // 添加数据线到数据序列。
            chart.Series.Add(dataSeries);

            //将生产的图表增加到Grid,然后通过Grid添加到上层Grid.
            Grid gr = new Grid();
            gr.Children.Add(chart);
            Simon.Children.Add(gr);
        }
View Code
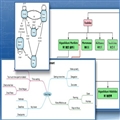
饼状图:
public void CreateChartPie(string name, List<string> valuex, List<string> valuey)
        {
            //创建一个图标
            Chart chart = new Chart();

            //设置图标的宽度和高度
            chart.Width = 580;
            chart.Height = 380;
            chart.Margin = new Thickness(100, 5, 10, 5);
            //是否启用打印和保持图片
            chart.ToolBarEnabled = false;

            //设置图标的属性
            chart.ScrollingEnabled = false;//是否启用或禁用滚动
            chart.View3D = true;//3D效果显示

            //创建一个标题的对象
            Title title = new Title();

            //设置标题的名称
            title.Text = name;
            title.Padding = new Thickness(0, 10, 5, 0);

            //向图标添加标题
            chart.Titles.Add(title);

            //Axis yAxis = new Axis();
            ////设置图标中Y轴的最小值永远为0
            //yAxis.AxisMinimum = 0;
            ////设置图表中Y轴的后缀
            //yAxis.Suffix = "斤";
            //chart.AxesY.Add(yAxis);

            // 创建一个新的数据线。
            DataSeries dataSeries = new DataSeries();

            // 设置数据线的格式
            dataSeries.RenderAs = RenderAs.Pie;//柱状Stacked


            // 设置数据点
            DataPoint dataPoint;
            for (int i = 0; i < valuex.Count; i++)
            {
                // 创建一个数据点的实例。
                dataPoint = new DataPoint();
                // 设置X轴点
                dataPoint.AxisXLabel = valuex[i];

                dataPoint.LegendText = "##" + valuex[i];
                //设置Y轴点
                dataPoint.YValue = double.Parse(valuey[i]);
                //添加一个点击事件
                dataPoint.MouseLeftButtonDown += new MouseButtonEventHandler(dataPoint_MouseLeftButtonDown);
                //添加数据点
                dataSeries.DataPoints.Add(dataPoint);
            }

            // 添加数据线到数据序列。
            chart.Series.Add(dataSeries);

            //将生产的图表增加到Grid,然后通过Grid添加到上层Grid.
            Grid gr = new Grid();
            gr.Children.Add(chart);
            Simon.Children.Add(gr);
        }
View Code
折线图:
public void CreateChartSpline(string name, List<DateTime> lsTime, List<string> cherry, List<string> pineapple)
        {
            //创建一个图标
            Chart chart = new Chart();

            //设置图标的宽度和高度
            chart.Width = 580;
            chart.Height = 380;
            chart.Margin = new Thickness(100, 5, 10, 5);
            //是否启用打印和保持图片
            chart.ToolBarEnabled = false;

            //设置图标的属性
            chart.ScrollingEnabled = false;//是否启用或禁用滚动
            chart.View3D = true;//3D效果显示

            //创建一个标题的对象
            Title title = new Title();

            //设置标题的名称
            title.Text = name;
            title.Padding = new Thickness(0, 10, 5, 0);

            //向图标添加标题
            chart.Titles.Add(title);

            //初始化一个新的Axis
            Axis xaxis = new Axis();
            //设置Axis的属性
            //图表的X轴坐标按什么来分类,如时分秒
            xaxis.IntervalType = IntervalTypes.Months;
            //图表的X轴坐标间隔如2,3,20等,单位为xAxis.IntervalType设置的时分秒。
            xaxis.Interval = 1;
            //设置X轴的时间显示格式为7-10 11:20
            xaxis.ValueFormatString = "MM月";
            //给图标添加Axis
            chart.AxesX.Add(xaxis);

            Axis yAxis = new Axis();
            //设置图标中Y轴的最小值永远为0
            yAxis.AxisMinimum = 0;
            //设置图表中Y轴的后缀
            yAxis.Suffix = "斤";
            chart.AxesY.Add(yAxis);


            // 创建一个新的数据线。
            DataSeries dataSeries = new DataSeries();
            // 设置数据线的格式。
            dataSeries.LegendText = "樱桃";

            dataSeries.RenderAs = RenderAs.Spline;//折线图

            dataSeries.XValueType = ChartValueTypes.DateTime;
            // 设置数据点
            DataPoint dataPoint;
            for (int i = 0; i < lsTime.Count; i++)
            {
                // 创建一个数据点的实例。
                dataPoint = new DataPoint();
                // 设置X轴点
                dataPoint.XValue = lsTime[i];
                //设置Y轴点
                dataPoint.YValue = double.Parse(cherry[i]);
                dataPoint.MarkerSize = 8;
                //dataPoint.Tag = tableName.Split('(')[0];
                //设置数据点颜色
                // dataPoint.Color = new SolidColorBrush(Colors.LightGray);
                dataPoint.MouseLeftButtonDown += new MouseButtonEventHandler(dataPoint_MouseLeftButtonDown);
                //添加数据点
                dataSeries.DataPoints.Add(dataPoint);
            }

            // 添加数据线到数据序列。
            chart.Series.Add(dataSeries);


            // 创建一个新的数据线。
            DataSeries dataSeriesPineapple = new DataSeries();
            // 设置数据线的格式。

            dataSeriesPineapple.LegendText = "菠萝";

            dataSeriesPineapple.RenderAs = RenderAs.Spline;//折线图

            dataSeriesPineapple.XValueType = ChartValueTypes.DateTime;
            // 设置数据点

            DataPoint dataPoint2;
            for (int i = 0; i < lsTime.Count; i++)
            {
                // 创建一个数据点的实例。
                dataPoint2 = new DataPoint();
                // 设置X轴点
                dataPoint2.XValue = lsTime[i];
                //设置Y轴点
                dataPoint2.YValue = double.Parse(pineapple[i]);
                dataPoint2.MarkerSize = 8;
                //dataPoint2.Tag = tableName.Split('(')[0];
                //设置数据点颜色
                // dataPoint.Color = new SolidColorBrush(Colors.LightGray);
                dataPoint2.MouseLeftButtonDown += new MouseButtonEventHandler(dataPoint_MouseLeftButtonDown);
                //添加数据点
                dataSeriesPineapple.DataPoints.Add(dataPoint2);
            }
            // 添加数据线到数据序列。
            chart.Series.Add(dataSeriesPineapple);

            //将生产的图表增加到Grid,然后通过Grid添加到上层Grid.
            Grid gr = new Grid();
            gr.Children.Add(chart);

            Simon.Children.Add(gr);
        }
View Code